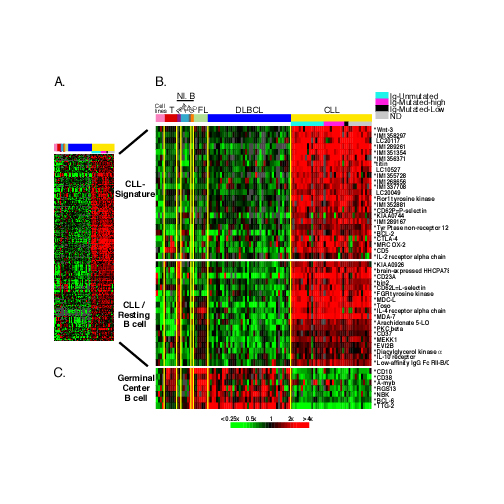
A. 338 Lymphochip array elements representing approximately 252 genes that were more highly expressed as mRNA in the majority of CLL samples relative to DLBCL samples. The expression data is presented as a matrix in which the rows represent individual genes, and the columns represent individual mRNA samples. The relative gene expression is depicted according to the colour scale shown at the bottom. Grey squares indicate missing or excluded data. In the gene names, an asterisk denotes a sequence verified gene, IM indicates an IMAGE consortium 23 clone identification number, and LC indicates an unsequenced Lymphochip clone identification number.
B.Relative expression levels of selected genes from a in mRNA samples presented in the following order, from left to right: cell lines (JVM-HH, OCI-Ly10, OCI-Ly3, U93 7), T-cells (adult, CD4+, unstimulated; neonatal, CD4+, unstimulated; fetal, CD4+, unstimulated; adult, CD4+, + PMA (P) and ionomycin (I); neonatal chord blood T-cells, + P and I; fetal, CD4+, + P and I), resting B-cells (cord blood CD19+ B-cells; blood CD19+ B-cells), activated B-cells (blood B-cells, anti-IgM + CD40L 6h; blood B-cells, anti-IgM 24h; blood B-cells, anti-IgM + CD40L 24h; blood B-cells, anti-IgM + IL-4 24h), memory B-cells (blood, CD27+), tonsil germinal centre B-cells, follicular lymphomas (n=7) and diffuse large B-cell lymphomas (n=40).
C.Relative expression levels of selected genes characteristic of the germinal centre B-cell differentiation stage.