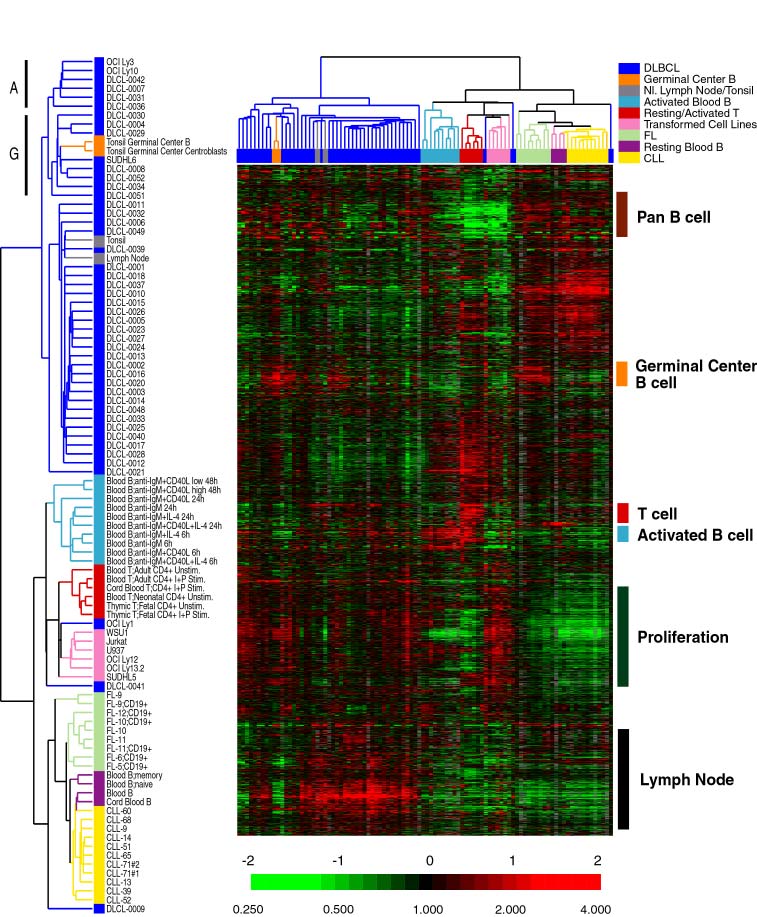
Heirarchical clustering of gene expression data. Depicted are the ~1.8 million measurements of gene expression made on 128 microarray analyses of 96 samples of normal and malignant lymphocytes. The dendrogram at the left lists the samples studied and provides a measure of relatedness of gene expression in each samples. The dendrogram is color coded based on the category of mRNA sample studied (see upper right key). Each row represents a separate cDNA clone on the microarray and each column a separate mRNA sample. The results presented represent the ratio of hybridization of fluorescent cDNA probes prepared from each experimental mRNA samples to a reference mRNA sample. These ratios are a measure of relative gene expression in each experimental sample and were depicted according to the color scale shown at the bottom. As indicated, the scale extends from fluorescence ratios of 0.25 to 4 (-2 to +2 in log base 2 units). Grey indicates missing or excluded data. See text for details.