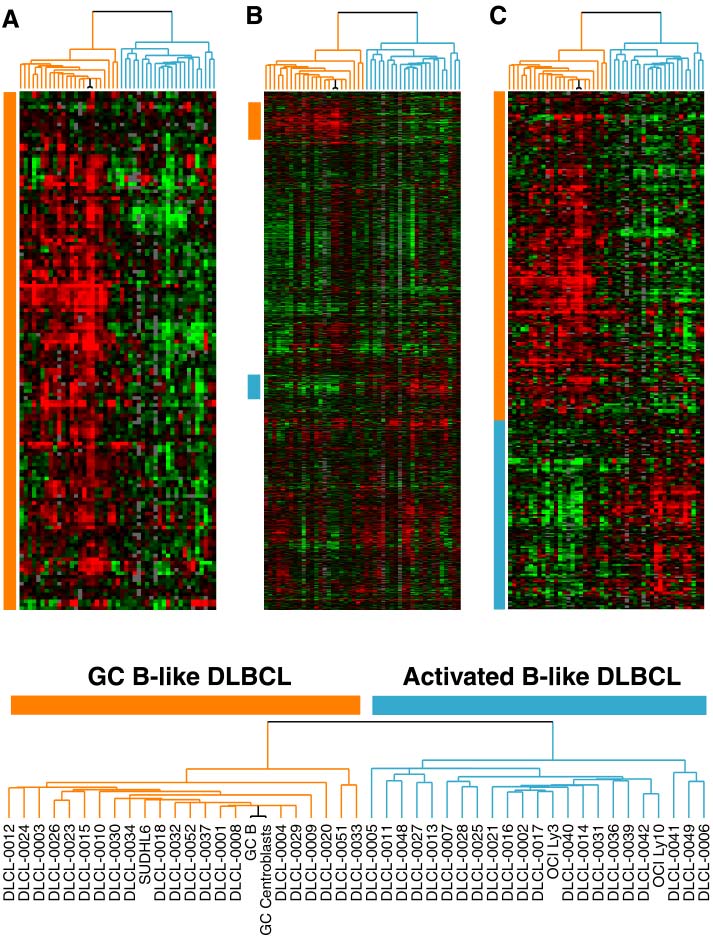
Discovery of DLBCL subclasses by gene expression profiling.
A. Heirarchical clustering of DLBCL cases (blue and orange) and germinal center B cells (black) based on the genes of the germinal center B cell gene expression signature shown in Figs. 1 and 2. Two DLBCL subgroups, GC B-like DLBCL (orange) and Activated B-like DLBCL (blue) were defined by this process.
B. Discovery of genes that are selectively expressed in GC B-like DLBCL and Activated B-like DLBCL. All genes from Fig. 1, with the exception of the genes in the proliferation, T cell and lymph node gene expression signatures, were ordered by heirarchical clustering while maintaining the order of samples determined in Fig. 3A. Genes selectively expressed in GC B-like DLBCL (orange) and Activated B-like DLBCL (blue) are indicated.
C. Heirarchical clustering of the genes selectively expressed in GC B-like DLBCL and Activated B-like DLBCL, discovered in Fig. 3B.
A listing of the samples used in this clustering analysis is shown at the bottom.