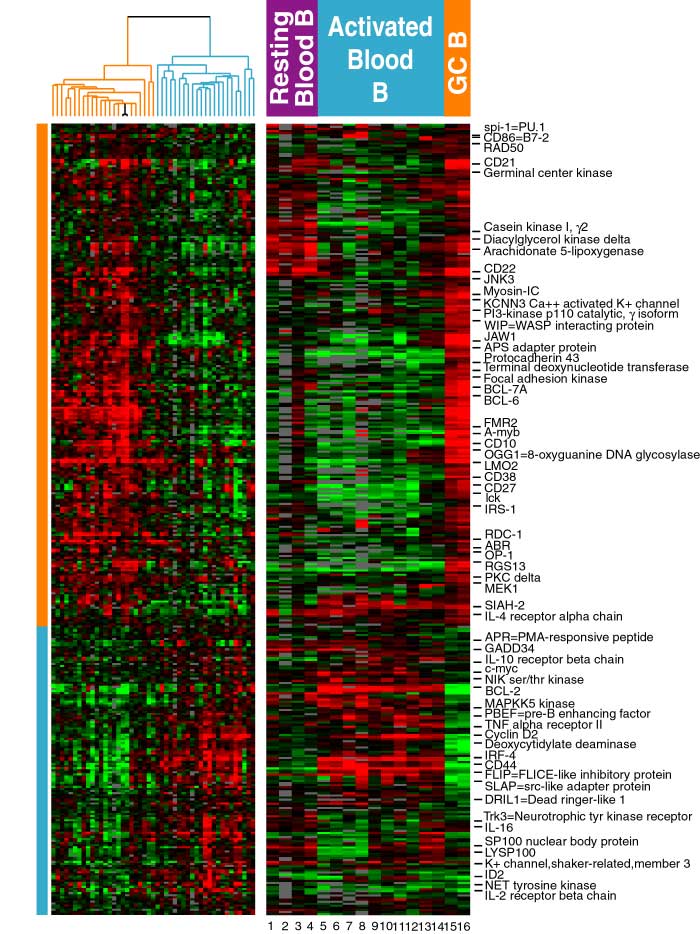
The data in the left panel are taken from Fig. 3C. The right panel depicts gene expression data from the following normal B cell samples:
1: Total CD19+ Blood B cells;
2: Naive CD27- blood B cells;
3: Memory CD27+ blood B cells;
4: Cord Blood CD19+ B cells;
5: Blood B cells;anti-IgM 6h;
6: Blood B cells;anti-IgM+IL-4 6h;
7: Blood B cells;anti-IgM+CD40L 6h;
8: Blood B cells;anti-IgM+CD40L+IL-4 6h;
9: Blood B cells;anti-IgM 24h;
10: Blood B cells;anti-IgM+IL-4 24h;
11: Blood B cells;anti-IgM+CD40L 24h;
12: Blood B cells;anti-IgM+CD40L+IL-4 24h;
13: Blood B cells;anti-IgM+CD40L low 48h;
14: Blood B cells;anti-IgM+CD40L high 48h;
15: Tonsil germinal center B cells;
16: Tonsil germinal center centroblasts.