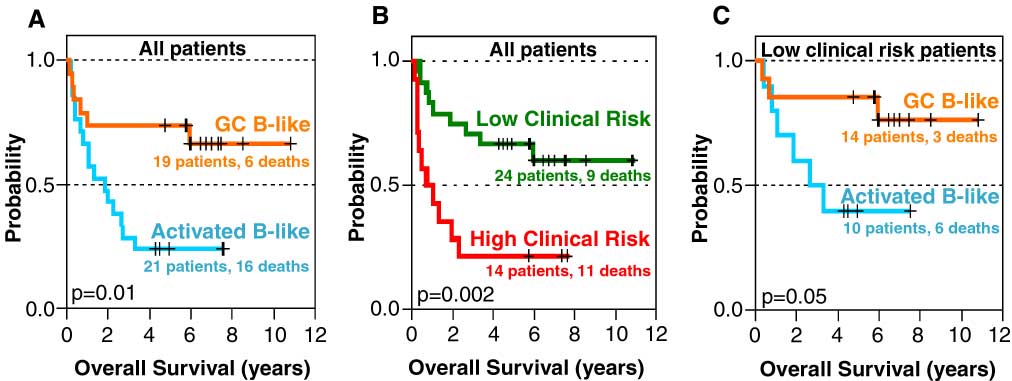
Clinically distinct DLBCL subgroups defined by gene expression profiling
A. Kaplan-Meier plot of overall survival of DLBCL patients grouped based on gene expression profiling.
B. Kaplan-Meier plot of overall survival of DLBCL patients grouped according to the International Prognostic Index (IPI).
(Note that for 2 of the 40 patients shown in Figure 5a, incomplete clinical data precluded the calculation of the IPI and thus the risk group).
Low clinical risk patients (IPI 0-2) and high clinical risk patients (IPI 3-5) are plotted separately.
C. Kaplan-Meier plot of overall survival of low clinical risk DLBCL patients (IPI 0-2) grouped based on gene expression profiling.