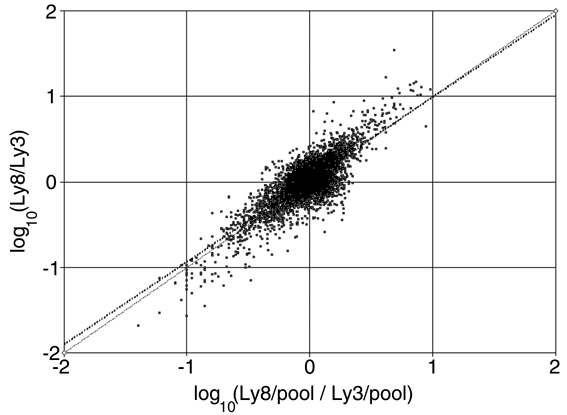
Comparison of Type 1 and Type 2 cDNA microarray experiments testing relative gene expression in two lymphoma cell lines, OCI Ly8 and OCI Ly3. Each dot in this plot represents a separate gene that was measured in both the Type 1 and Type 2 experiments. The x-axis displays the results from a Type 2 experiment in which each cell line mRNA was compared to a common control mRNA pool. The log 10 of the "indirect" relative ratio of gene expression from this experiment was calculated as indicated. The y-axis depicts the results from a Type 1 experiment in which the two lymphoma cell line mRNAs were directly compared on the same microarray. The log 10 of the "direct" relative ratio of gene expression from this experiment was calculated as indicated.