Home
Return to the LLMPP Homepage
Explorer
Interactively explore the figures
Search
Search the LLMPP Microarray dataset
Figures
View figures from the paper
Analysis
Data analysis methods and links
Supplement
View additional tables & figures
Help
Get help with interpretation of the data
Download
Download the primary data
Authors
List of authors
|
|
|

|
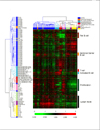
Figure 1:
Taxonomic Relationships Between Normal & Malignant
Lymphoid Populations
Browse in detail using GeneExplorer
Search this figure by gene name
Also available in Portable Document Format (PDF), 715 Kb
|

|
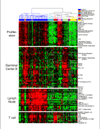
Figure 2:
Gene expression clusters reflect biological relationships and processes
Also available in Portable Document Format (PDF), 56 Kb
|

|
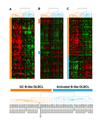
Figure 3:
Discovery of DLBCL subclasses
Also available in Portable Document Format (PDF), 315 Kb
|

|
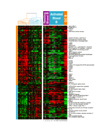
Figure 4:
Relationship of DLBCL subgroups to normal B lymphocyte differentiation
and activation.
Browse in detail using GeneExplorer
Also available in Portable Document Format (PDF), 88 Kb
|

|
Figure 5:
DLBCL Subgroups Are Clinically Distinct
Also available in Portable Document Format (PDF), 49 Kb
|
|


